Short Introduction to "AllThatStats now"
We'd like to introduce DSI's brand new mobile-ready time series services ![]() .
.
Powerful algorithms support a frustration-free workflow and allow to create charts ready for publication within seconds.
Access all major statistical time series databases from e.g. the World Bank, UNIDO, OECD, or Eurostat.
Content
- Your first chart ready for publication within 60 seconds
- Processing final charts
- Sign in for your personal account
- Managing your personal collection
Your first chart ready for publication within 60 seconds
Video "60 seconds to chart"
Learn how to create a publication-ready chart.
Example:
Go to the search bar, located at the top of each page.
Start your search, for instance "population Ireland".

Select the first hit: OECD's database "Labour Force Statistics - Population and vital statistics".

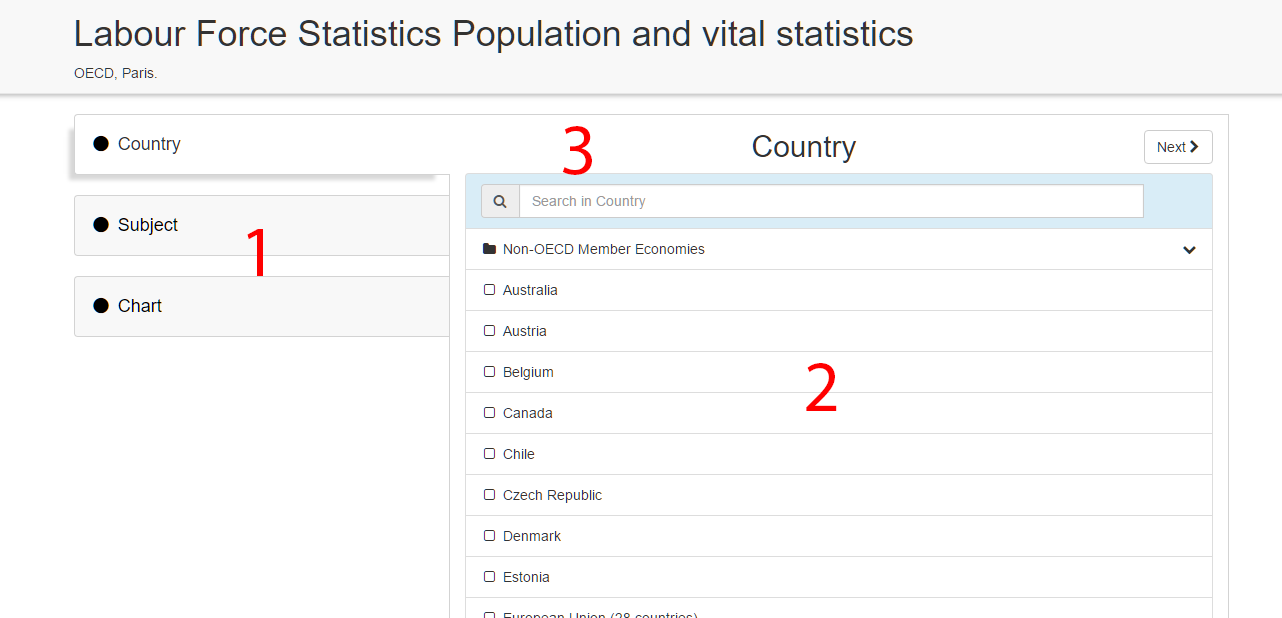
It shows the main components of the underlying classification plan on the left hand side: Country and Subject (1), and once selected - their corresponding sub-components or items in this box on the right hand side (2).
Access both components by choosing what you are looking for:
country: Ireland
subject: population mid-year estimates total
Note: The search tool, here at the top of each list (3), supports your selection, especially when browsing large lists.

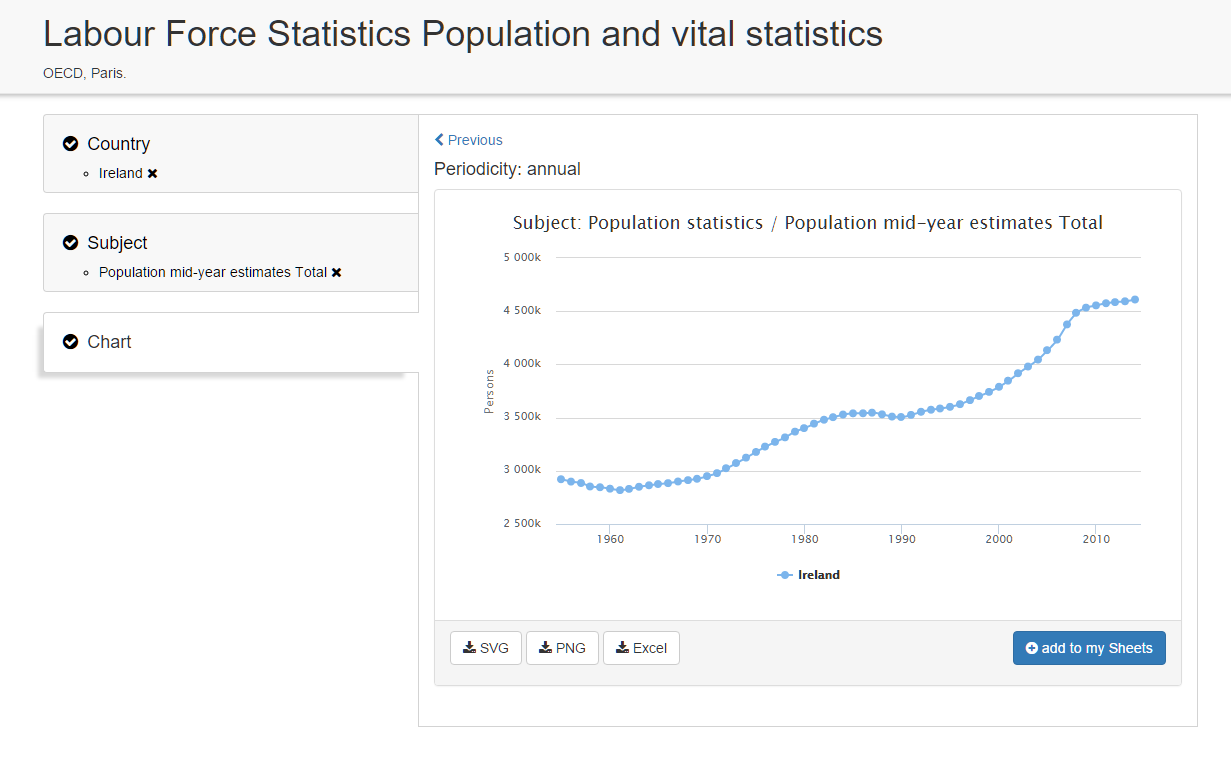
Finally: click the chart button and generate your publication-ready chart.

What's next?
Processing final charts
Download your chart as a high resolution image (1), e.g. to make it part of a publication.
In addition, you can download the entire data time series in Excel format (2) to make it available for further analysis.
Finally, there is a third option that transfers the chart respective data time series to your personal collection (3): "add to my sheets".

Sign in for your personal account
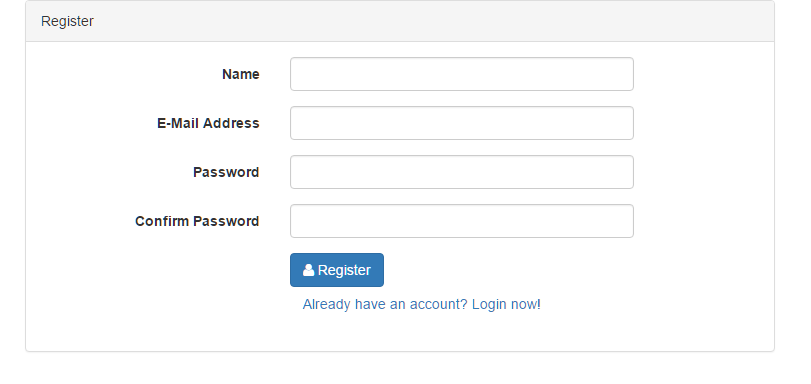
Generating an account allows you to store any chart/time series selection - as shown above - to your personal collection of sheets. When logged in already, you get access to your personal sheet collection automatically. Not yet registered? No problem you can register yourself on the fly...
Sign in for a free 30 days trial (for first time users)
Go to "Register"

confirm your registration by clicking to the "Register" button
Managing your personal collection
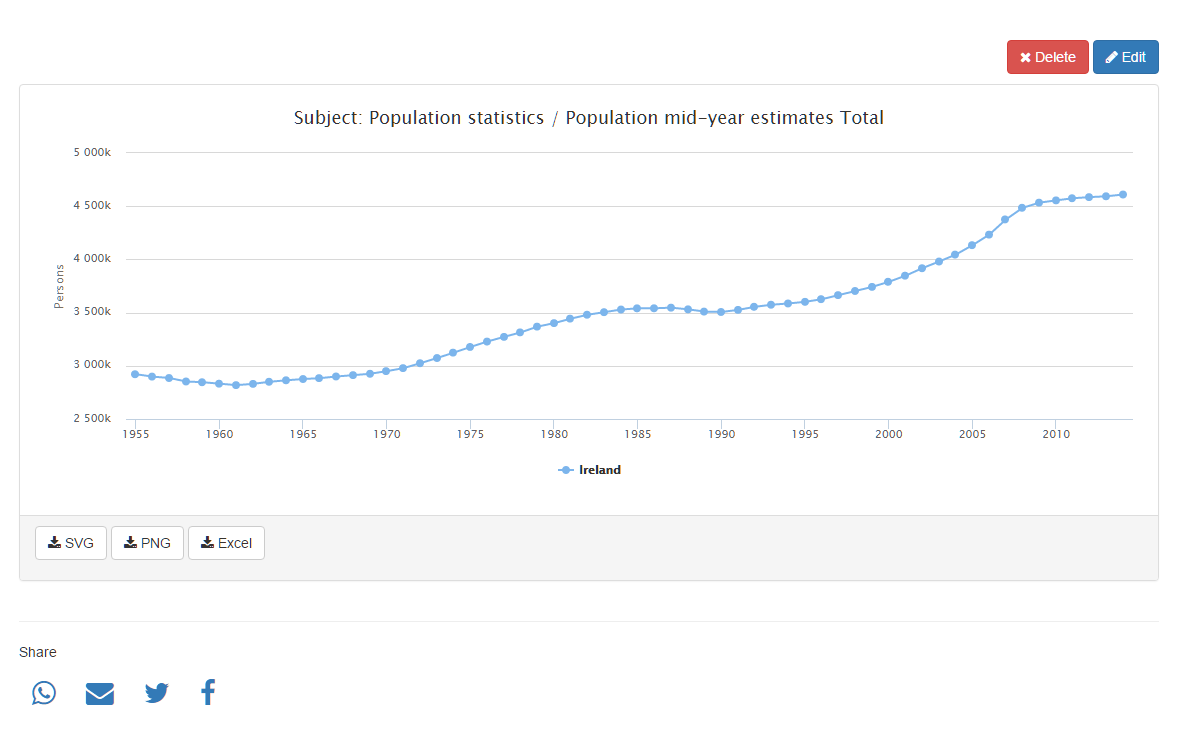
Your personal collection of sheets saves your retrieval work for later/further action. Edit your charts manually or share them with friends and colleagues by mail, WhatsApp, Twitter or Facebook.
